We’ve entered crunch time, with students and PIs working feverishly to collect data as the end of our time in Siberia quickly approaches. Today, Lindsey Parkinson (Western Washington University) and I spent the afternoon in the field measuring carbon flux on various vegetation types. Carbon flux refers to the uptake of CO2 (photosynthesis) and release of CO2 (respiration). Vegetation can influence carbon flux in a number of ways. First, soil moisture, temperature and active layer depth all vary with vegetation type and these factors influence microbial activity and hence respiration and CO2 release. Additionally, plant functional types vary in their photosynthetic rate (CO2 uptake) as well their respiration rate. As the storage of carbon in Arctic soils is significant, understanding the dynamics of carbon flux from soil and vegetation will inform our understanding of the global carbon cycle.
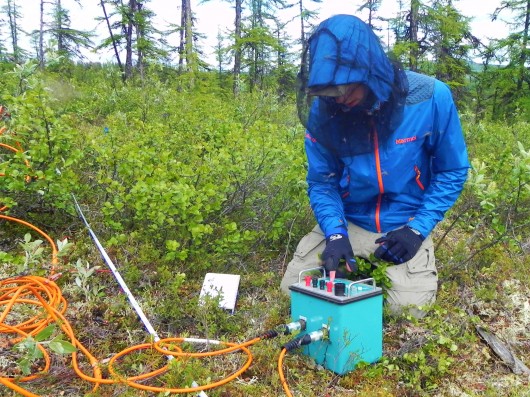
By enclosing roughly a 0.5m3 of vegetation in a clear plexiglass enclosure built by Sue Natali, I can measure changes in CO2 concentrations as soil and plants respire/photosynthesize. After plotting CO2 concentration with time, the slope of a best fit line translates into the rate of CO2 flux, either positive (respiration exceeds photosynthesis) or negative (photosynthesis exceeds respiration). I’m interested in differences in carbon flux between vegetation types and am measuring flux in both high and low density larch forests with future hopes to scale up my flux measurements to a larger spatial scale with a larch density biomass map that was created previously be Polaris Participants.
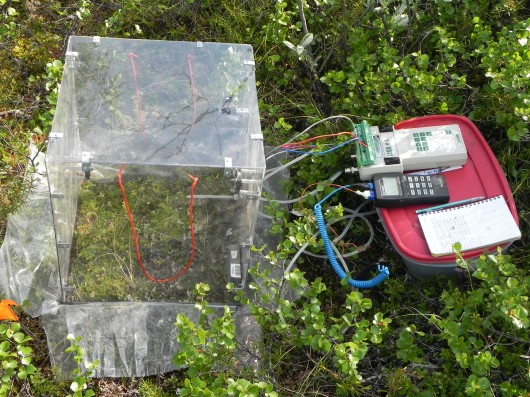
The chamber I use to measure carbon flux, with a LICOR 820 and temperature probe attached.
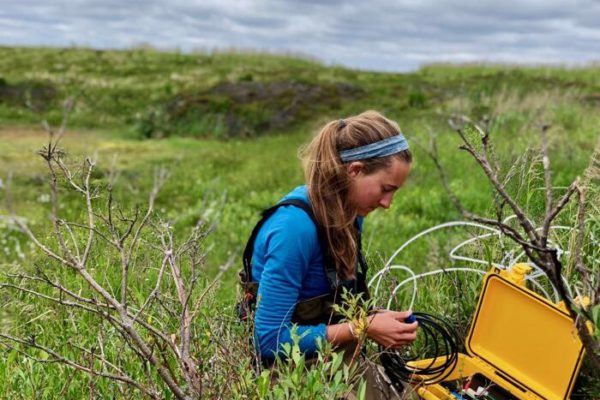
Additionally, to better understand how vegetation type influences carbon flux, Mike Loranty (also of Colgate University) and I are using a technique called electrical resistivity imaging to look at soil and permafrost characteristics under different vegetation types. Upon placing electrodes along a transect, we send a current through the electrodes and into the ground. Adjacent electrodes pick up this current and depending on the moisture content, temperature and other properties of the soil/permafrost, the current will vary. Based upon these variances, a computer algorithm can calculate the resistivity of the soil along a horizontal and vertical profile. So, Mike and I have been using this technique along transects that run through the three vegetation types I am focusing on – mosses, lichens, and shrubs. And we are seeing differences below ground associated with these plant functional types, particularly between lichen and non-lichen vegetation patches. Active layer depth, resistivity, and hence soil moisture content differ markedly underneath lichen and adjacent vegetation patches. These differences likely arise from below ground characteristics, moisture and temperature, which influence microbial metabolic activity and respiration or the rate at which carbon is released from the soil.
Over the coming week, I hope to gather additional flux measurements from plots along these resistivity transects and to correlate carbon flux with resistivity values as a proxy for the below ground characteristics that influence respiration rates. A great deal of work remains to be completed in the coming week but with the help of Mike, Sue and others, I am confident that it will be completed.